Bitcoin's 67-Day Negative Funding Rate Record and Short Squeeze Setup in May 2026
Bitcoin's funding rate turned positive after a record 67-day negative streak in 2026, with daily liquidations dropping 87.9% to USD 50.26M on May 9.
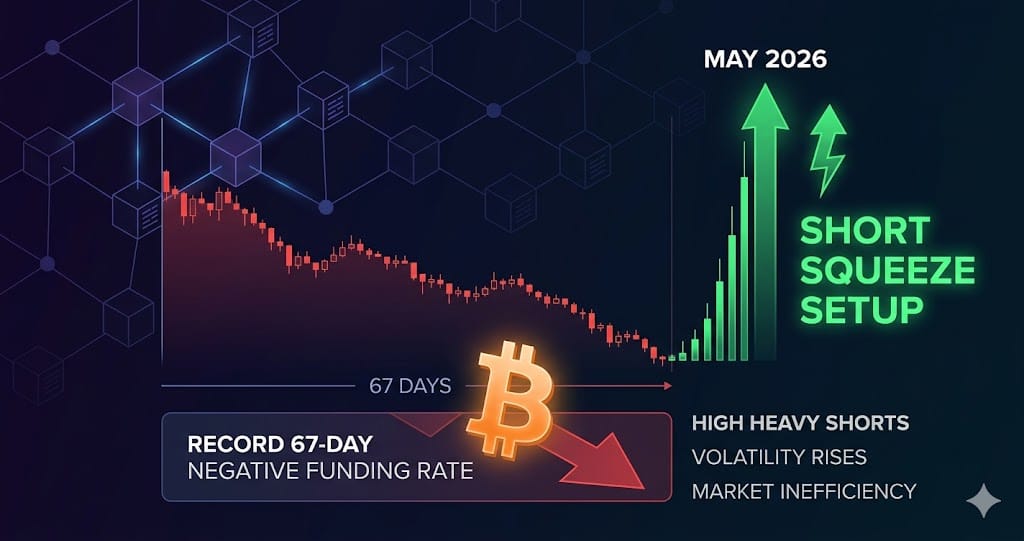
Bitcoin's perpetual funding rate turned positive on May 9-10, 2026, breaking a 67-day consecutive negative streak that exceeded the 2020 COVID crash benchmark of 62 days, according to K33 Research. Daily liquidations on May 9 fell 87.9% to USD 50.26 million from the USD 415.57 million peak recorded two days earlier on May 7.
With Binance BTC open interest holding at USD 8.34 billion and the long/short ratio sitting at 36.7% long versus 63.3% short as of May 9-10, the market structure points toward a potential short squeeze if BTC clears the USD 83,600 resistance zone. K33 historical backtesting shows that buying during negative 30-day average funding rate periods produced win rates of 83% to 96% across all holding windows from 30 to 360 days.
Liquidation Cascade Exhausts After a 16-Day Forced-Closure Chain
The 16-day liquidation sequence running from April 30 to May 7, 2026 has entered a third-act exhaustion phase. Single-day liquidations collapsed from USD 415.57 million on May 7, which involved 113,153 forced closures and USD 318 million (76.6%) in short liquidations, to USD 50.26 million on May 9 — a decline of 87.9% in roughly 48 hours.
May 8 saw approximately USD 300 million in futures liquidations, independently categorized by CoinDesk as a US-Iran tension reversal cascade with direction reversing from the prior short-squeeze chain. The 16-day cumulative short liquidation total reached roughly USD 1.27 billion by May 9, but the single-day pace has fallen to one-eighth of the May 7 peak. CoinGlass data confirms the pattern consistent with the final stage of a multi-act liquidation sequence, where easily-triggered positions near spot price are exhausted and the next wave requires a larger price catalyst.
The 67-Day Negative Funding Rate Record: What It Means
K33 Research confirmed on May 8-9 that Bitcoin perpetual funding had remained negative for 67 consecutive days starting around March 1, 2026, surpassing the prior benchmark of 62 days set during the 2020 COVID crash recovery period from March 15 to May 16. The second-longest prior streak was 46 days during the FTX collapse in November to December 2022.
Binance BTC/USDT perpetual funding showed a precise reading of -0.0037% (annualized approximately -4.05%) against a 30-day average of -5%, compared to the historical normal of roughly +8%. The May 9-10 window recorded a tentative flip to +0.0043% on Binance, signaling that passive cost pressure on short positions is beginning to reverse. However, open interest did not decline alongside the rate flip, indicating new short positions were being opened at USD 79,000 to USD 81,000 at near-neutral funding costs — a second-order imbalance that has replaced the original one.
Cross-Asset Negative Funding and the ETH Short Squeeze Risk
The negative funding regime extends beyond Bitcoin. CoinGlass cross-readings from May 9-10 show ETH perpetuals at -0.0038% (annualized -4.16%), SOL at -0.0036%, and XRP at -0.0025%. ETH carries the deepest negative rate among the four major assets and simultaneously holds open interest near a 2026 record high of 14.17 million ETH, a dual imbalance that places ETH closer to a short squeeze inflection point than BTC on current data.
Any short position opened after March 1, 2026, across BTC, ETH, SOL, or XRP has accumulated more than 5% in cumulative passive funding cost losses by May 9, independent of price movement. On-chain DEX venues including Hyperliquid and dYdX show funding rates synchronized in the negative direction on 1-hour intervals, confirming that both centralized and decentralized short positions face equivalent pressure. The convergence of CeFi and DeFi short exposure means a cross-chain, cross-asset squeeze could unfold simultaneously rather than sequentially.
Geopolitical Risk Shifts from Event Shock to Persistent Premium
Earlier market framing treated US-Iran tensions as binary event risk, but the April-May 2026 timeline reflects a structural shift. The sequence ran from the April 11 talks breakdown through the April 18 Strait of Hormuz closure to the May 6 M/T Hasna tanker strike and the May 8 dual tanker strikes in the Gulf of Oman — two separate military actions within three days. Bitcoin futures markets have begun pricing a continuous geopolitical risk premium rather than discrete event reactions.
As of May 9-10, BTC is consolidating between USD 79,000 and USD 80,000 with the 200-day moving average and the long-term descending trendline converging at USD 83,600, and the trend reversal confirmation level sitting at USD 85,000. The combination of exhausted cascade momentum, a funding rate inflection point, and a persistent geopolitical premium creates a binary setup: a sustained close above USD 83,600 would activate the remaining short liquidation pool, while a break below USD 76,000 support would reset the structure and force long-side closures instead.
What to Watch
- BTC USD 83,600 resistance — convergence of the 200-day moving average and long-term descending trendline; a daily close above this level is the trigger for the remaining short liquidation pool accumulated above current spot price
- Daily liquidation volume on CoinGlass — a return above USD 100 million per day would signal renewed cascade momentum rather than the exhaustion continuation confirmed by the May 9 USD 50.26 million reading
- Binance BTC/USDT 8-hour funding rate — sustained positive readings above +0.0050% would confirm the 67-day negative streak has fully reversed and that passive short position cost pressure is releasing at scale
- ETH open interest relative to the 14.17 million ETH 2026 record high — ETH's deeper negative funding rate of -0.0038% makes it the highest-probability short squeeze candidate among major assets if broader market conditions shift upward
Ready to start trading?
Trade on Bitget Try CoinTech2uAffiliate links — we may earn a commission at no extra cost to you.
Related Articles
- Bitcoin's 67-Day Negative Funding Rate Record: What It Means in 2026
- Bitcoin's 66-Day Negative Funding Streak and the May 2026 Liquidation Cascade
- Crypto Market Sentiment Breakdown 2026: Fear, Funding Rates, and Macro Risk Signals Explained
Frequently Asked Questions
What does a 67-day negative funding rate mean for Bitcoin traders?
A negative perpetual funding rate means short position holders pay long holders on a recurring 8-hour basis. After 67 consecutive days at an average annualized rate of -5%, short positions opened after March 1, 2026 had absorbed more than 5% in cumulative funding costs by May 9, independent of price action. K33 Research backtesting across 10 years shows that buying BTC during periods of negative 30-day average funding rates produced win rates between 83% and 96% across all holding windows from 30 days to 360 days, with median excess returns of 1.84x to 6.27x compared to random entry points.
Why did Bitcoin liquidations drop 87.9% between May 7 and May 9, 2026?
The USD 415.57 million liquidation event on May 7 represented the peak of a 16-day cascade chain, with USD 318 million (76.6%) of that single day coming from short positions being force-closed. The most price-accessible short positions near spot levels were already cleared by that point. By May 9, daily liquidations fell to USD 50.26 million, indicating that the easily-triggered short positions had been exhausted. CoinGlass data shows the next significant short squeeze wave would require either a breakout above USD 83,600 to reach deeper stop levels, or a collapse below USD 76,000 support to trigger long-side liquidations instead.
How do the US-Iran tanker strikes in May 2026 affect Bitcoin's price structure?
The May 6 strike on M/T Hasna and the May 8 dual strikes in the Gulf of Oman established a repeated pattern within three days, shifting market interpretation from single-event risk to a persistent geopolitical premium. Bitcoin futures markets had previously reacted to discrete Iran-related events as binary de-escalation versus escalation signals. The 3-day two-strike cycle indicates that BTC futures are now incorporating a baseline risk premium, which means individual headline sensitivity should moderate while the underlying price floor supported by geopolitical uncertainty remains elevated into the foreseeable term.


