Bitcoin Fear & Greed Hit 8 in June 2026: What the Data Reveals
Bitcoin's Fear & Greed Index hit 8 on June 8, 2026. How USD 3.58B ETF outflows, a 29% OI flush, and stacked shorts set up the mid-June reversal.
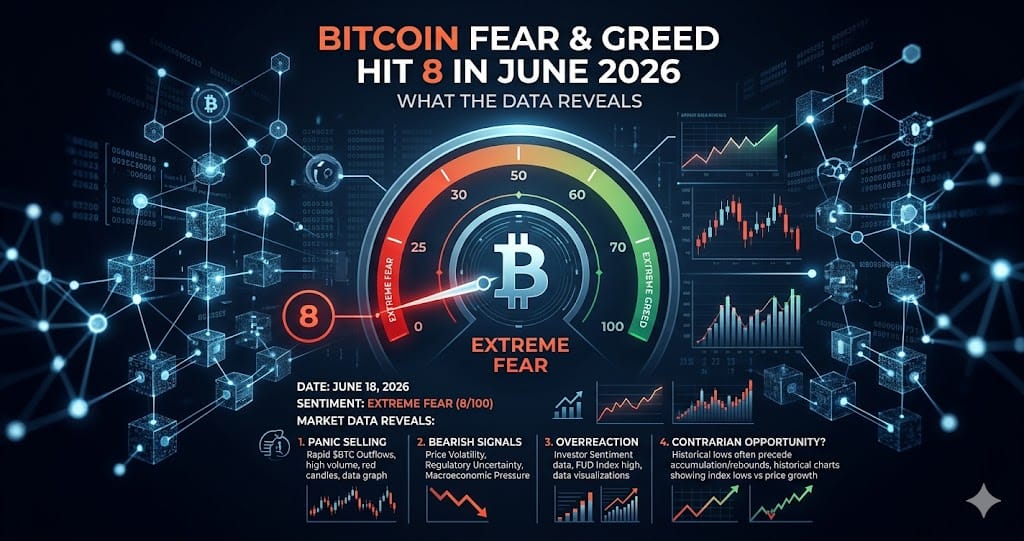
Bitcoin's Fear & Greed Index touched 8 on June 8, 2026 — a reading last seen during the 2022 bear market — just six days before an estimated USD 536 million in short liquidations triggered a forced-buy cascade on June 14 through 16. The sequence is traceable: 108 consecutive days of fear, a brief recovery to neutral 50 on May 6, then a seven-day collapse back to extreme fear by June 2.
The data trail behind that collapse includes USD 3.58 billion in cumulative spot Bitcoin ETF outflows over 12 days, open interest dropping 29% from USD 31 billion to USD 22 billion, and more than 11,000 BTC worth approximately USD 726 million quietly moved from exchange order books into cold storage on June 17 alone. Each of these indicators, read in sequence, maps the regime change that produced the mid-June squeeze and frames the binary risk heading into the Federal Reserve's June 17 FOMC decision.
The 108-Day Fear Streak and the Seven-Day Sentiment Cliff
From January 17, 2026, Bitcoin's Fear & Greed Index remained in fear territory for 108 consecutive trading days. The streak ended on May 6 when the index reached a neutral reading of 50, coinciding with BTC holding near USD 81,000 and total crypto market cap at approximately USD 2.66 trillion, according to Tapbit's index tracker. Within a week, the index edged briefly into greed at 52 before reversing.
The reversal was fast and severe. In roughly seven days, the index fell from greed 52 down to extreme fear 23 by June 2. By June 8, Alternative.me recorded a reading of 8 while CoinMarketCap reported 15 for the same date — both the lowest readings of the year. That seven-day cliff from greed to extreme fear was not a gradual drift; it compressed sentiment to a level that historically coincides with crowded-short positioning and sets the conditions for a sharp counter-directional move.
ETF Outflows and the OI Flush That Reset Positioning
The sentiment collapse had a clear capital-markets driver. Spot Bitcoin ETFs recorded a cumulative net outflow of USD 3.58 billion across 12 consecutive days leading into early June. June 1 alone saw USD 483.8 million exit the products, and June 2 registered the largest single-day outflow in the stretch at USD 519.1 million, according to CoinStats data. This was institutional money withdrawing at scale, not retail panic — which explains why the Fear & Greed Index hit bear-market-era lows even as derivatives positioning was simultaneously being cleaned up.
On the derivatives side, open interest across exchanges dropped from USD 31 billion to USD 22 billion, a 29% reduction by the time the index hit its June 8 low. Crucially, average funding rates held at a positive 0.005%, meaning the flush removed the most dangerously leveraged long exposure while preserving a baseline bullish lean in the market. According to Phemex's funding rate data, that combination — lower OI with still-positive rates — signals deleveraging without capitulation, and it removed the chain-liquidation risk that had built over 46 to 47 prior days of negative funding rates.
The June 14-16 Short Squeeze: Reading the Liquidation Ledger
When the reversal arrived between June 14 and June 16, short positions dominated the liquidation data. Shorts accounted for an estimated 70% to 74% of total forced closes, with aggregate liquidations reaching approximately USD 536 million on June 16. This was the mechanical output of the crowded-short regime: traders who had shorted into the extreme fear readings were caught by a rapid upside move, and each short forced to close added incremental buying pressure that extended the squeeze.
The long-short account ratio data from CoinGlass provides an important structural context. That metric counts accounts rather than capital, which creates a measurable divergence: when All Accounts show a ratio below 1.0, indicating more accounts net short, while Top Traders simultaneously show ratios above 1.5, large capital is positioned long while retail crowds short. That pattern, visible in the June 8 through June 13 window, is the sentiment-indicator counterpart to the on-chain signal of large-wallet exchange inflows tracked ahead of the squeeze.
FOMC on June 17: The USD 58K Floor vs the USD 75,709 Short Ceiling
After the short squeeze, BTC entered a narrow consolidation range of USD 64,503 to USD 66,768 on June 17, a daily range of only about 1.4%, as traders reduced exposure ahead of the Federal Reserve's rate decision. Markets priced in a 97.4% probability of no change to the 3.50% to 3.75% target rate. The critical variable is the dot plot: with CPI at 4.2% year-over-year, a three-year high, any signal removing further 2026 rate cuts puts the model-identified downside liquidation zone of USD 58,000 to USD 60,000 in play.
On the upside, liquidation heatmap data from CryptoRank shows approximately USD 474 million in stacked short positions clustered around USD 75,709. A related estimate from BeInCrypto placed short losses at roughly USD 440 million as BTC approached USD 75,000, confirming the zone as a high-density liquidity target. The June 17 on-chain data adds a directional lean: more than 11,000 BTC worth approximately USD 726 million was withdrawn from exchange order books into cold storage, compressing available sell-side liquidity. That supply reduction tilts the structural bias toward the upside scenario, but the FOMC dot plot remains the decisive near-term variable for either direction.
What to Watch
- USD 75,709 on BTC spot — CryptoRank heatmap data shows approximately USD 474 million in short liquidations stacked at this level; a sustained break above it would trigger forced buy-backs and could accelerate into a continuation squeeze
- USD 58,000 to USD 60,000 on BTC spot — automated trading models identify this zone as the primary downside liquidation target if the June 17 FOMC dot plot removes expected 2026 rate cuts amid CPI at 4.2%
- Fear & Greed Index daily reading on Alternative.me — after recovering from a low of 8 on June 8 toward neutral in mid-June, a return below 20 would signal renewed de-risking and potential for another open interest flush
- Spot Bitcoin ETF daily net flow — after 12 consecutive outflow days totaling USD 3.58 billion, any sustained reversal to net inflows would confirm institutional re-entry and support the upside scenario toward USD 75,709
Ready to start trading?
Trade on Bitget Try CoinTech2uAffiliate links — we may earn a commission at no extra cost to you.
Related Articles
- Bitcoin Short Squeeze June 2026: $536M Liquidated in 24 Hours
- Bitcoin's June 2026 Liquidation Cascade: $3.5B Forced Selling Explained
- Crypto Narratives 2026: Fair Launch, Prediction Markets, and InfoFi Emerge
Frequently Asked Questions
Why did Bitcoin's Fear & Greed Index fall to 8 in early June 2026?
The index hit 8 on June 8, 2026, driven by two converging forces. First, spot Bitcoin ETFs saw 12 consecutive days of outflows totaling USD 3.58 billion, with single-day records of USD 519.1 million on June 2 and USD 483.8 million on June 1, representing institutional capital withdrawal at scale. Second, market sentiment had already reversed sharply from a brief greed reading of 52 in late May, collapsing to extreme fear 23 by June 2 and to 8 by June 8 — the lowest reading of the year and comparable to 2022 bear market levels according to Alternative.me data.
What is the significance of the USD 75,709 price level for Bitcoin?
Liquidation heatmap data from CryptoRank identifies approximately USD 474 million in short positions clustered around USD 75,709. If BTC spot price reaches that level, those shorts face forced liquidation, generating a wave of compelled buy orders that would add momentum to any upside move. A corroborating estimate from BeInCrypto put short losses at approximately USD 440 million as BTC approached USD 75,000, confirming the zone as a high-density liquidity concentration and a plausible continuation target if the FOMC outcome is read as neutral or dovish.
How does the June 17 FOMC decision affect Bitcoin's near-term price range?
Markets priced in a 97.4% probability of no change to the Fed funds target of 3.50% to 3.75% at the June 17 meeting. The real variable is the dot plot projection for the rest of 2026. With CPI running at 4.2% year-over-year, a three-year high, any language removing anticipated rate cuts would push BTC toward the model-identified downside target of USD 58,000 to USD 60,000. A dovish or unchanged dot plot leaves the upside path open toward the USD 75,709 short-squeeze level, where USD 474 million in shorts remain stacked.