Crypto Liquidations May 2026: USD 657M Wiped and What Comes Next
USD 657M in crypto liquidations hit May 2026 as BTC crashed below USD 77K. Learn the three macro triggers, funding rate signals, and what comes next.
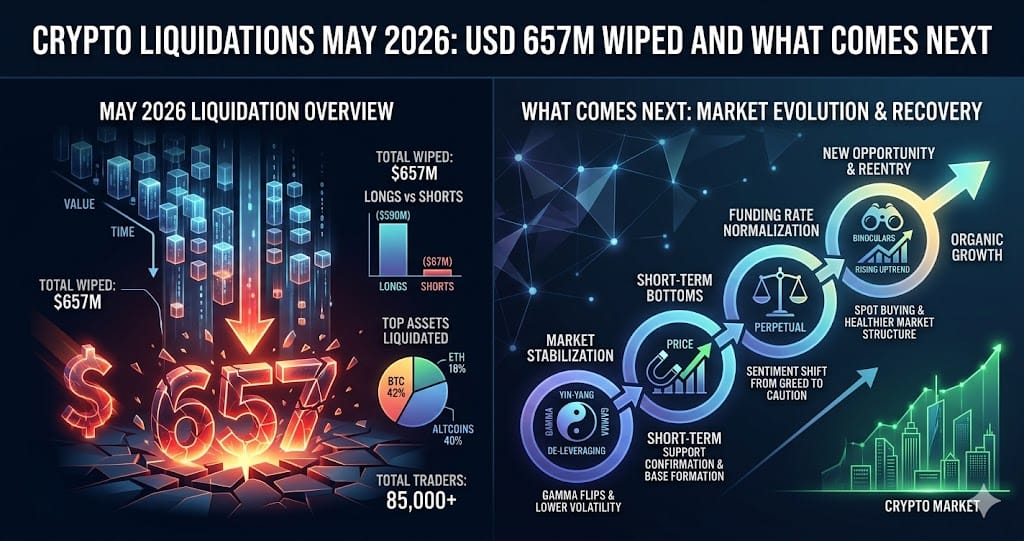
USD 657M in crypto positions were liquidated in a single 24-hour window in May 2026, with long traders absorbing USD 584M of those losses as BTC fell below USD 77K for the fourth consecutive day. Three converging macro factors drove the cascade: the US 10-year Treasury yield breaking above 5.1%, escalating Iran-related geopolitical tension, and inflation-driven risk-off sentiment.
The liquidation event came after bullish leverage had grown heavily crowded heading into the drawdown. Spot Bitcoin ETFs recorded net outflows of USD 1.039B between May 11 and May 15, 2026, ending six consecutive weeks of net inflows, while Ethereum ETFs shed USD 255M over the same period. That institutional unwind removed a critical support layer just as derivatives leverage peaked across major venues.
The Perfect Storm: Three Macro Triggers Behind USD 657M in Liquidations
The US 10-year Treasury yield crossing 5.1% was the clearest macro trigger for the May 2026 crypto selloff. When risk-free rates reach that level, capital rotation out of speculative assets tends to accelerate sharply, and highly leveraged crypto positions become the first to face forced closes. The CLARITY Act's advancement through the Senate Banking Committee created a brief relief rally, but the bounce failed to hold and BTC resumed its decline below USD 77K.
The Iran geopolitical escalation and inflation panic compounded the yield pressure simultaneously. Reports of US military strikes and drone incidents pushed risk sentiment into defensive positioning across global markets. Crypto markets, already carrying heavy long leverage from weeks of ETF-driven optimism, were structurally unprepared for a three-factor shock arriving at once. The combination produced what analysts described as a "perfect storm," and the USD 584M long liquidation total supports that characterization.
Machi Big Brother: A Named Case Study in Recurring High-Leverage Losses
Entrepreneur Jeffrey Huang, known by the on-chain alias Machi Big Brother, is one of the most documented individual casualties of the May 2026 cascade. On-chain data showed his active positions were liquidated when BTC breached USD 77K. Within hours of being wiped out, Huang opened a fresh 25x leveraged long on 1,825 ETH valued at approximately USD 3.87M, setting his liquidation price at USD 2,086.69 against an ETH spot price of USD 2,021 at the time.
Over less than one year, Huang's cumulative perpetual contract losses reached USD 77.32M. That figure matters beyond the individual: it is concrete on-chain evidence that a segment of high-leverage traders continues to replenish the liquidation engine despite repeated wipeouts. Huang's open ETH position sits within roughly 3% of its liquidation threshold, making it a live pressure point that could contribute to a localized volatility spike if ETH approaches USD 2,087.
Funding Rate Signals: Negative Rates Across Binance, OKX, and Bybit
BTC perpetual funding rates flipped briefly positive on May 27, 2026, ending an 84-day consecutive negative streak, but reverted to deeply negative within 24 hours. Cross-exchange data shows rates are now simultaneously negative across Binance at roughly -0.005% per 8 hours, OKX at -0.007%, and Bybit at -0.011%. That gradient places the heaviest short concentration at Bybit, which carries the most acute exposure to a short-squeeze event if price moves sharply upward.
Ethereum's derivatives market presents a parallel but distinct structure. On May 28, ETH futures open interest hit an all-time high of 16.39M ETH, approximately USD 32.5B in notional value, while funding rates remained modestly negative. Rising open interest paired with negative funding during sideways-to-lower price action is a textbook setup for a potential short squeeze. The funding rate arbitrage window between venues has widened to approximately 0.02626% per 8 hours, equivalent to roughly 29% annualized, reflecting growing liquidity fragmentation across exchanges following three consecutive cascade events.
May 31 Recovery: Reading the Bounce After the Liquidation Flush
The Crypto Fear and Greed Index recovered from a cycle low of 5 to a reading of 35 by May 31, 2026, remaining in the Fear zone but representing a meaningful shift in sentiment. BTC opened at USD 73,525 on May 29 and was attempting a move toward USD 74,000 by May 31, while ETH reclaimed the USD 2,021 level with a market cap near USD 243.7B. These are the first coordinated cross-asset sentiment and price recovery signals since daily liquidation volume peaked and then fell sharply to USD 82M on May 30.
The recovery is best classified as a fragile relief bounce rather than a structural reversal. BTC remains below the USD 75,000 max pain level and ETH stays under USD 2,200 max pain, and the USD 80,000 to USD 85,000 call wall is still deeply out of the money with dealer gamma positioning unstable. Historically, deeply negative funding rates have coincided with local bottoms including March 2020, mid-2021, and the FTX collapse in November 2022, but each required a specific positive catalyst to convert the short-squeeze setup into an actual sustained move.
What to Watch
- Machi Big Brother's open ETH long at 25x leverage carries a liquidation price of USD 2,086.69, placing it within 3% of the May 31 spot price of USD 2,021 and making it a live volatility catalyst near current levels
- Bybit's funding rate at -0.011% per 8 hours is the deepest short concentration among major exchanges, making it the most vulnerable venue for a localized short squeeze if price moves upward from current levels
- ETH futures open interest at an all-time high of 16.39M ETH with simultaneously negative funding creates a textbook short-squeeze structure, contingent on a positive catalyst to trigger forced short covering
- The US 10-year Treasury yield relative to the 5.1% threshold remains the key macro circuit breaker — a sustained move above that level would likely cap any crypto recovery attempt regardless of on-chain positioning
Ready to start trading?
Trade on Bitget Try CoinTech2uAffiliate links — we may earn a commission at no extra cost to you.
Related Articles
- Crypto Market Week in Review: Key Narratives for Late May 2026
- Crypto Liquidation Cascade Exhaustion: BTC and ETH Risk Map for May 2026
- Crypto Narratives 2026: DATCO Bust, AI Tokens, and Selective Altseason
Frequently Asked Questions
What caused the USD 657M crypto liquidation event in May 2026?
Three macro factors converged simultaneously: the US 10-year Treasury yield breaking above 5.1%, escalating Iran geopolitical tensions following reported US military strikes, and inflation-driven risk-off sentiment. These hit a market that was structurally vulnerable because bullish leverage had grown heavily crowded in the preceding weeks, and spot BTC ETFs had already recorded USD 1.039B in net outflows between May 11 and May 15, removing a key support layer just before the cascade.
What do negative funding rates on Bitcoin and Ethereum perpetuals mean for traders?
Negative funding rates mean short traders are paid by long traders to maintain their positions, signaling that short-side demand is dominant in the derivatives market. When rates go deeply negative across Binance, OKX, and Bybit simultaneously, as occurred in May 2026, it has historically coincided with local price bottoms including March 2020 and the FTX collapse in November 2022. However, converting that setup into an actual short squeeze requires a specific positive catalyst to force short positions to close, and without one, deeply negative rates can persist as a sign of sustained selling pressure rather than an imminent reversal.
Is the May 31, 2026 crypto price recovery a sign that the bear phase is over?
The available data points to a fragile relief bounce rather than a structural reversal. BTC remains below the USD 75,000 max pain level, ETH is below USD 2,200 max pain, and the USD 80,000 to USD 85,000 call wall is still deeply out of the money. The Fear and Greed Index recovered from 5 to 35 but stays in Fear territory. Each of these metrics is consistent with short covering and a sentiment reset after extreme liquidation volume, not a change in the underlying market structure.