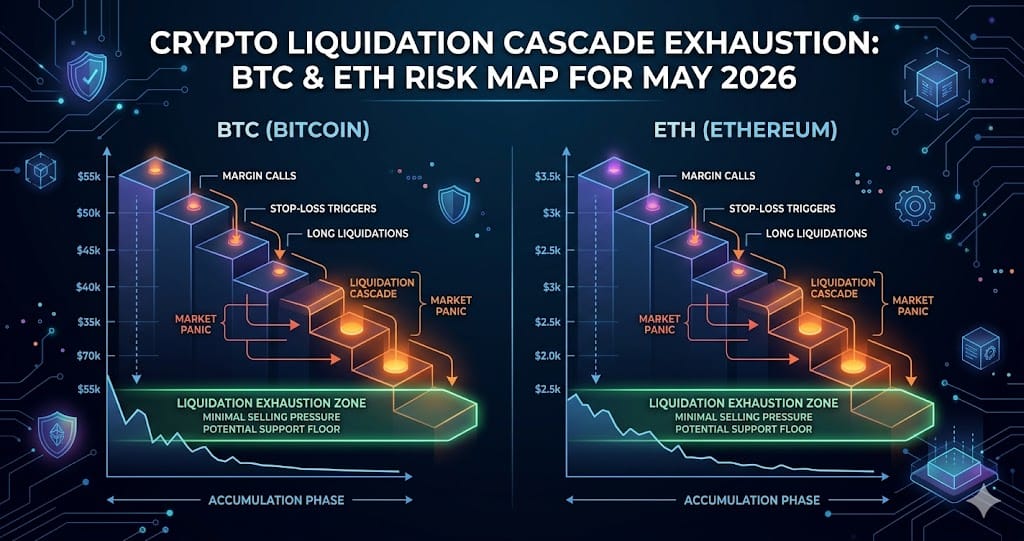
Crypto Liquidation Cascade Exhaustion: BTC and ETH Risk Map for May 2026
After USD 958.8M in May 28 liquidations, crypto 24-hour totals fell 91% to USD 82M. ETH below USD 2,000 with record open interest marks the next
Global crypto liquidations fell 91.4% from their May 28, 2026 peak of USD 958.8 million — which forced 167,706 accounts to close — to just USD 82.01 million in the 24 hours ending May 30, with only 29,384 accounts liquidated and hourly volume running at USD 548,700. The three-wave cascade that began on May 15 at USD 500 million, accelerated to USD 941 million on May 22, and peaked on May 28 following U.S. strikes on Iran has temporarily depleted the pool of highly leveraged positions available to flush.
Risk has not disappeared — it has migrated from Bitcoin to Ethereum. BTC recovered USD 73,000 after a USD 352 million liquidation sweep but stalled below USD 73,500. Meanwhile ETH dropped through the USD 2,000 psychological level while coin-margined futures open interest reached an all-time high of USD 34.97 to 35.61 billion. That combination of record leverage and weakening spot demand is the structural setup for the next wave of forced selling.
The Three-Wave Cascade and Its Mechanical Exhaustion
The May 2026 liquidation sequence unfolded in three measurable waves. On May 15 the 24-hour total reached USD 500 million. It climbed to USD 941 million on May 22, then peaked at USD 958.8 million on May 28 when U.S. military action against Iran pushed Bitcoin below USD 73,000 and triggered margin calls on 167,706 accounts across Binance, Bybit, OKX, and Bitget simultaneously — CoinGlass aggregated data confirmed this was a synchronized cross-exchange event, not a single-venue anomaly.
By May 30 the 24-hour total had collapsed to USD 82.01 million, a 91.4% decline in dollar terms and an 82% decline in account count. This deceleration follows the mechanical logic of forced deleveraging: once high-leverage accounts are liquidated, they cannot rebuild instantly, and the inventory of vulnerable positions is temporarily depleted. The market enters a low-volatility absorption window before the next catalyst refills the pipeline.
BTC's USD 352M Sweep and the Fragile USD 73,000 Recovery
When Bitcoin broke below USD 72,700 on May 28, it triggered a single-wave liquidation sweep totaling USD 352 million. Buyers stepped in and pushed price back above USD 73,000 within hours. The recovery stalled before reaching USD 73,500, and analysts covering the move reported a clear bias toward managing downside exposure rather than chasing the bounce — a posture consistent with the broader risk-off tone from the Strait of Hormuz conflict.
The Deribit options settlement on May 29 added context. Of the 80,535 contracts representing USD 6.25 billion in notional value that expired, the USD 80,000 call wall of USD 532 million — 7,856 BTC — expired worthless with Bitcoin trading well below that strike. The USD 75,000 put concentration of USD 394 million and a put-to-call ratio of 0.86 reflected modestly bullish positioning, but with price anchored near USD 73,000, the max-pain gravitational range of USD 75,000 to USD 79,000 exerted no meaningful pull on settlement.
ETH Below USD 2,000 — Record Open Interest and the Dual-Direction Risk Setup
Ethereum's breach of USD 2,000 this week occurred simultaneously with global futures open interest reaching an all-time high of USD 34.97 to 35.61 billion, with coin-margined open interest specifically at a record peak. ETH 24-hour liquidations were running at USD 59.4 million as of May 30. The funding rate has shifted into negative territory, meaning short sellers are now paying long holders — a configuration that reflects newly established bearish positioning driven by the USD 2,000 breakdown rather than a long-standing crowded-short dynamic.
CryptoDaily and CryptoNexa analysts have framed this as a "moonshot or massacre" configuration — record leverage amplifies any directional move regardless of which way price breaks. The underlying cause is structural: capital rotated from ETH spot into Bitcoin whale addresses earlier in May, draining spot demand. Yet derivatives exposure did not decline with it; instead it expanded to record levels. When spot demand shrinks while leveraged exposure grows, the gap between price-discovery and forced-liquidation thresholds narrows, making ETH the most sensitive trigger point for the next cascade.
What the 84-Day Negative Funding Rate Streak Actually Signaled
Bitcoin perpetual futures funding rates turned positive on May 27, ending an 84-day consecutive negative streak — the longest since at least 2020 according to CoinGlass data showing the Binance BTC/USDT 30-day average below zero from approximately March 1 onward, with K33 Research head Vetle Lunde citing the 46-day milestone reached on April 15 as already the longest since the post-FTX period in November 2022. During the full 84-day stretch, Bitcoin gained 14.5%, confirming that spot buyers accumulated even as perpetuals stayed net short.
Research firm 10x Research offered a competing explanation: the negative rates reflected institutional structural hedging — funds shorting futures to manage risk on other book positions — rather than broad bearish conviction. The 30-day average rate ran at negative 5% against a historical norm of positive 8%. That distinction carries trading significance: structural hedgers do not squeeze the same way speculative crowded shorts do. In practice the May 27 flip lasted less than 24 hours before geopolitical events pushed rates back down, and the reversal occurred against a backdrop of USD 1.26 billion in BTC spot ETF net outflows over seven days and spot volumes at their lowest single-day reading since February 7, 2024 — conditions that make any funding-rate recovery signal structurally fragile.
What to Watch
- ETH USD 2,000 level: coin-margined futures open interest at an all-time high of USD 35.61 billion means a sustained break below USD 2,000 could concentrate the next cascade in Ethereum before BTC positions are meaningfully rebuilt.
- BTC spot ETF flows: net outflows reached USD 1.26 billion over seven days and USD 2 billion over 14 days through May 30, with ETP holdings falling back to February 2026 levels — a reversal to sustained net inflows would be the clearest sign that institutional demand has returned.
- BTC perpetual funding rates: the 84-day negative streak ended May 27 but was reversed within 24 hours; a confirmed, multi-day positive rate accompanied by rising spot volume would validate K33's gradual recovery framework rather than another false dawn.
- Geopolitical developments around the Strait of Hormuz: the May 28 peak cascade of USD 958.8 million was directly triggered by U.S. strikes on Iran; any escalation in that corridor would likely restart forced liquidations before the current low-volatility absorption window closes.
Ready to start trading?
Trade on Bitget Try CoinTech2uAffiliate links — we may earn a commission at no extra cost to you.
Related Articles
- Crypto Narratives 2026: DATCO Bust, AI Tokens, and Selective Altseason
- Bitcoin Falls Below USD 73,000 in Third Cascade Wave — May 2026
- Crypto Whale Wipeouts and Sentiment Collapse: May 2026 Cascade Analysis
Frequently Asked Questions
What caused the USD 958.8 million Bitcoin liquidation spike on May 28, 2026?
U.S. military strikes on Iran prompted a sharp risk-off move that pushed Bitcoin below USD 73,000. The price drop triggered cascading margin calls across major exchanges simultaneously — CoinGlass data confirmed Binance, Bybit, OKX, and Bitget all saw synchronized liquidation spikes — forcing 167,706 accounts to close in a single 24-hour window. This was the third and largest wave in a cascade sequence that began May 15 at USD 500 million and escalated through USD 941 million on May 22.
Why is Ethereum considered the highest liquidation risk even though cascade activity has slowed?
ETH futures open interest hit an all-time high of USD 34.97 to 35.61 billion precisely as spot demand weakened and price broke below the USD 2,000 psychological threshold. Coin-margined open interest is specifically at a record, funding rates have turned negative as new short positions are established, and ETH 24-hour liquidations were still running at USD 59.4 million as of May 30. Record derivatives exposure combined with declining spot demand narrows the gap between current price and forced-liquidation thresholds, making ETH the most structurally vulnerable asset if a new macro or geopolitical catalyst materializes.
Does a negative Bitcoin funding rate mean traders are bearish, and what happened when it turned positive?
Not necessarily. A negative funding rate means short positions are paying long positions to stay open, indicating net short bias in perpetuals. However 10x Research argued that the 84-day negative streak — where the 30-day average hit negative 5% versus a normal positive 8% — reflected institutional structural hedging rather than speculative bearishness. Bitcoin gained 14.5% during that entire period, supporting the interpretation that spot buyers were active. K33 Research's Vetle Lunde noted that returning to positive rates has historically marked gradual recoveries, but the May 27 flip lasted less than 24 hours before geopolitical events and USD 2 billion in ETF outflows over 14 days pushed the market back into defensive positioning.