Bitcoin's $1.85 Billion Liquidation Cascade Explained: June 2026
BTC crashed to a 4-month low of USD 65,707 on June 3 2026, triggering USD 1.85B in liquidations. Here is what drove the cascade and what comes next.
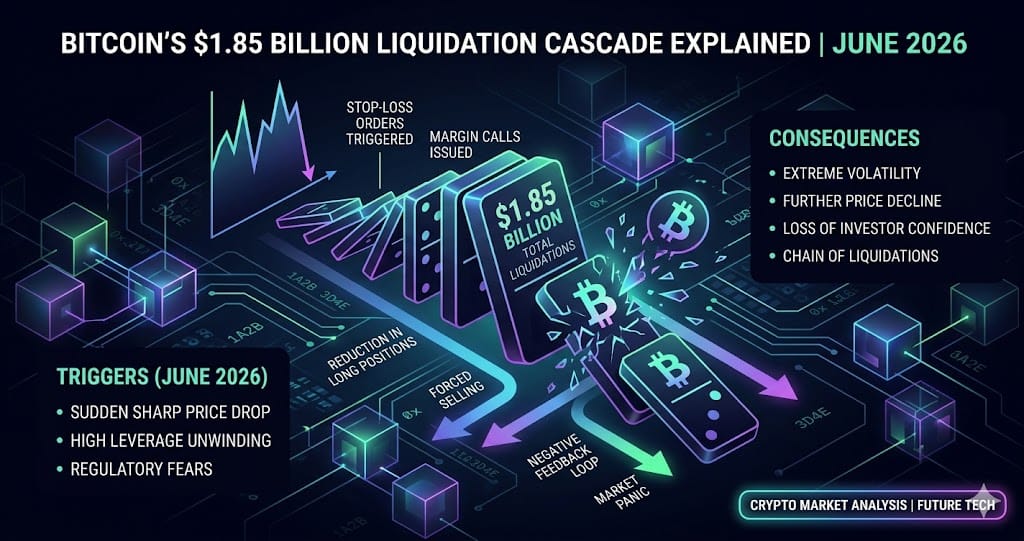
Bitcoin fell to USD 65,707 on June 3, 2026 — a four-month low — erasing more than 12% of its value over seven days and forcing USD 1.85 billion in liquidations across approximately 279,500 accounts in a single 24-hour window.
Despite widespread media attribution to MicroStrategy's sale of 32 BTC (roughly USD 2.5 million), analysts at cryptonews and Yahoo Finance have since clarified that a USD 2.5 million sale cannot mechanically produce a USD 1.85 billion liquidation event. The actual driver was excess leverage concentrated at a cluster of tightly spaced technical levels that had been accumulating for weeks before the cascade fired.
How the cascade unfolded across June 2 and June 3
The sequence began on June 2 when BTC broke below USD 70,000, printing an intraday low of USD 69,691 and clearing USD 744 million in liquidations across roughly 152,000 accounts. Rather than finding a floor, price continued lower into June 3. BTC dropped from USD 71,765, broke USD 68,000, and within a single hour cleared approximately USD 394 to 400 million in forced sells before settling near USD 67,895.
Over the full 24-hour period on June 3, total liquidations reached USD 1.85 billion — roughly 2.5 times the prior day's figure. BTC long positions alone accounted for USD 894.5 million, with ETH longs contributing a further USD 480.5 million. The liquidation magnets that triggered each sequential wave were clustered at USD 72,000, USD 70,000, USD 69,000, and USD 68,300 — each level acting as a forced-sell trigger that pushed price into the next cluster below it.
Root cause: overleveraged longs in a deteriorating technical structure
The dominant analytical consensus after June 3 moved away from event-driven explanations. Cryptonews explicitly labeled the blaming-Saylor narrative as wrong, pointing instead to excess leverage built into a market that was already technically breaking down. BTC futures open interest had compressed from approximately USD 42 billion in early May to a six-month low of USD 25 billion by late May, meaning the cascade was mechanically deleveraging an already-crowded position stack rather than responding to a single news catalyst.
The directional skew of the liquidations is the clearest supporting evidence. Long positions represented 75.6% of all forced closes in the primary wave, climbing to 92% or more across all major exchanges during the four-hour peak window. On Hyperliquid, long liquidations reached 94.44% of all forced sells — the most extreme reading among tracked platforms — consistent with a retail-heavy, one-directional leverage stack being systematically cleared rather than a two-sided correction.
Derivatives structure: funding rates, open interest, and the basis collapse
The derivatives context had been deteriorating well before June 3. CoinGlass data shows BTC perpetual funding rates on Binance, Bybit, and OKX turned negative around March 1, 2026 and remained there for at least 46 consecutive days — the longest sustained negative funding window since the FTX collapse in November 2022. During April's peak speculative activity, funding had reached positive 0.05% to positive 0.08% per eight-hour period. By late May it had compressed to a range of negative 0.005% to positive 0.005%, oscillating around zero. The cash-and-carry basis on BTC futures collapsed from roughly 12% annualized to 4 to 5% over the same period.
One structural counterpoint: despite negative funding rates, BTC futures open interest rose approximately 12% over the month preceding the crash, which Phemex identified as a crowded short signal. Historically, similar setups in November 2022 and June 2021 preceded bounces of 48% and 65% respectively within 60 days. That comparison comes with the caveat that the current price action has not yet confirmed a reversal, and the June 26 options expiry with a max pain price of USD 77,500 — more than 15% above the June 3 close — represents a significant gravitational force on price through the end of the month.
Sentiment, options expiry, and the six-factor framework
The Crypto Fear and Greed Index registered 23 on June 3, categorized as Extreme Fear and the lowest reading since the April 2026 selloff. This invalidated any recovery narrative built on the May 31 reading of 35, which some analysts had interpreted as early stabilization. Analyst Lark Davis identified six contributing factors: spot BTC ETF net outflows of USD 519.19 million on June 2 (led by BlackRock and Fidelity), Strategy's BTC sale, anticipated Mt. Gox distributions, capital rotation into AI equities, the technical breakdown below USD 70,000, and the four-year halving cycle.
The capital-rotation-into-AI-stocks factor is notable because it was absent from earlier analytical frameworks focused on the crypto-native catalysts. ETH perpetual funding rates turned negative earlier than BTC — around March 11 — but ETH options skew remained in a neutral range at the time, suggesting institutional hedging activity rather than directional short conviction. The June 26 expiry carries approximately USD 8.5 to 9 billion in nominal open interest, and with BTC well below max pain at USD 77,500, a large proportion of call open interest now faces near-zero expiration value unless price recovers materially before settlement.
What to Watch
- BTC price action relative to USD 68,300 and USD 70,000 — both are confirmed liquidation cluster levels from the June 3 cascade and are likely to act as resistance on any near-term recovery attempt
- BTC futures open interest recovery from the six-month low of USD 25 billion — any rebound in OI accompanied by a return to positive funding rates would signal renewed speculative demand and reduced short crowding
- June 26 options expiry with max pain at USD 77,500 and approximately USD 8.5 to 9 billion in nominal open interest — the single largest near-term structural catalyst and a significant price gravity anchor through late June
- Crypto Fear and Greed Index: currently at 23 (Extreme Fear); a sustained move above 40 has historically preceded sentiment-driven stabilization, though it is not sufficient on its own to confirm a directional reversal
Ready to start trading?
Trade on Bitget Try CoinTech2uAffiliate links — we may earn a commission at no extra cost to you.
Related Articles
- Bitcoin's Record 67-Day Negative Funding Streak and June 2026 Liquidation Risk
- 2026 Crypto Narratives: Capital Is Rotating, Not Retreating
- Crypto Liquidations May 2026: USD 657M Wiped and What Comes Next
Frequently Asked Questions
Why did Bitcoin crash so sharply on June 3, 2026?
BTC fell to USD 65,707 on June 3 primarily because excess leverage had accumulated in long positions across derivatives exchanges as the market structure was already breaking down. As price broke below key levels at USD 72,000, USD 70,000, USD 69,000, and USD 68,300 in sequence, cascading forced liquidations cleared USD 1.85 billion in positions within 24 hours. MicroStrategy's sale of 32 BTC (roughly USD 2.5 million) was widely cited as the trigger, but analysts have pointed out that a USD 2.5 million trade cannot mechanically produce a USD 1.85 billion liquidation event — overleveraged longs in a deteriorating technical structure were the structural cause.
What is a liquidation cascade and how does it amplify a price move?
A liquidation cascade occurs when leveraged positions are automatically closed by an exchange once price moves against them past a predetermined threshold called the liquidation price. Each forced close adds selling pressure to the market, which can push price into the next cluster of liquidation levels below, triggering additional forced sells in a chain reaction. In the June 3 event, four tightly spaced liquidation clusters between USD 68,300 and USD 72,000 fired in sequence. Long positions accounted for more than 92% of forced closes during the peak four-hour window, and in a single hour after the USD 68,000 break, approximately USD 400 million in positions were cleared.
What does negative funding rate data tell us about Bitcoin's next move?
Negative funding rates mean short positions are paying long positions to hold their trades, which reflects a market where short sellers have become the dominant leveraged group. BTC perpetual funding rates on Binance, Bybit, and OKX remained negative for at least 46 consecutive days starting around March 1, 2026 — the longest such window since November 2022. The complicating factor is that during this same period, BTC futures open interest rose approximately 12%, which Phemex interprets as a crowded short setup rather than a simple bearish signal. The two prior instances of this combination — November 2022 and June 2021 — preceded significant bounces within 60 days, though the current setup has not yet shown price confirmation of a reversal.