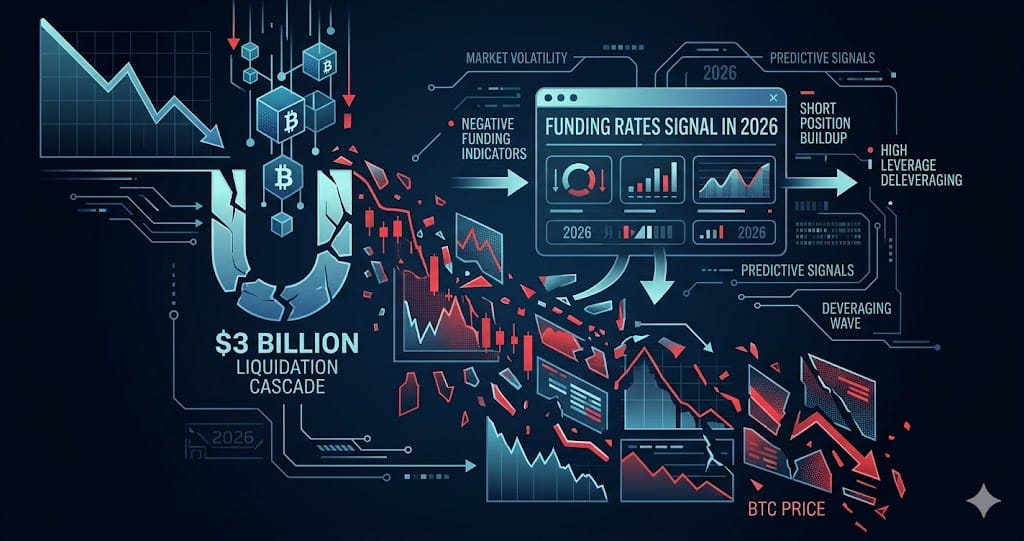
Bitcoin's USD 3 Billion Liquidation Cascade: What Funding Rates Signal in 2026
Bitcoin shed over USD 3 billion in two days as futures OI peaked at 773,000 BTC. Here is what funding rates are signaling for the next move.
Between June 2 and June 4, 2026, over USD 3 billion in crypto positions were force-liquidated as Bitcoin broke below USD 61,500, with 85% of those liquidations hitting long positions and BTC longs alone accounting for USD 777 million. Open interest had reached a historical peak of 773,000 BTC on June 2 before the breakdown, and the Fear and Greed Index collapsed to 12 out of 100 by June 5, the deepest fear reading of this cycle.
The three structural causes, ranked by weight, are cross-asset capital rotation away from crypto into AI equities, spot ETF outflows exceeding USD 3.4 billion over 11 consecutive redemption sessions, and an over-leveraged futures structure with clustered liquidation zones between USD 68,300 and USD 72,000. Strategy's sale of 32 BTC worth roughly USD 2.5 million, representing approximately 0.004% of its 843,706-BTC holding valued near USD 61 billion, and Mt. Gox wallet movements were emotional triggers, not structural causes.
The Three Structural Causes Behind the June 2026 Crash
Capital rotation is the primary driver. Institutional money has been moving from crypto into AI-related equities, removing the persistent bid that supported Bitcoin through 2024 and 2025. This is a deliberate portfolio reallocation rather than panic selling, which makes it difficult to time a reversal based on sentiment alone.
Spot Bitcoin ETFs saw outflows exceeding USD 2.8 billion over recent trading sessions, with a broader window showing USD 3.4 to 3.5 billion leaving over 11 consecutive outflow days. That sustained redemption pace removed a structural buyer that had supported prices since the 2024 ETF launches and amplified the effect of any directional selling pressure.
The third cause is technical. Open interest in Bitcoin futures reached a historical high of approximately 773,000 BTC on June 2, concentrating leveraged longs at price levels that became liquidation magnets once selling began. Clustered positions between USD 68,300 and USD 72,000 amplified the downward move in a self-reinforcing feedback loop, producing the outsized USD 3 billion two-day total.
Funding Rate Signals: What the Derivatives Market Is Telling You
Bitcoin perpetual swap funding rates briefly flipped negative during the June 3 to June 4 cascade, confirmed by MEXC data, meaning short-side traders were temporarily being paid to hold their positions. This is the derivatives market's clearest sign of forced long liquidations: when longs are blown out en masse, the funding rate drops as demand for leveraged long exposure collapses.
The broader context is a six-week structural trend. Binance, Bybit, and OKX perpetual funding rates turned negative around March 1, 2026, and remained negative for at least 46 consecutive days as of mid-April. The 30-day average rate sat near negative 5%, compared to a historical norm of roughly positive 8%, a 13-percentage-point gap that 10x Research attributes to institutional players shorting futures as a hedge against other holdings, not as a directional bearish bet.
As of June 5, the annualized funding rate has recovered to approximately positive 10%, with a long-to-short ratio of 69% long versus 31% short, which exceeds the 65% threshold that typically signals crowded long positioning. A new cohort of leveraged longs entered immediately after the June 4 flush, reloading the same structural risk that produced the original cascade.
Open Interest and the Mechanics of the Liquidation Chain
Bitcoin futures open interest peaked at 773,000 BTC on June 2, then fell 5.29% over seven days to USD 51.45 billion across all exchanges, according to Coinalyze data covering the full exchange universe. That peak was the supply-side explanation for why clustered liquidation levels between USD 68,300 and USD 72,000 produced such outsized price impact: more leveraged longs were stacked at those levels than at any prior point in this cycle.
The June 4 session alone saw over USD 1 billion in liquidations, with 85% hitting long positions and Bitcoin longs contributing USD 777 million of that total. A 24-hour open interest drop of nearly 5% confirmed this was forced deleveraging rather than incremental hedging, a distinction CoinMarketCap's derivatives dashboard used to classify the event as a leverage flush rather than a gradual repositioning.
Despite the flush, total open interest remains elevated and the long-to-short ratio has not meaningfully corrected. Until open interest declines to pre-buildup baseline levels and the funding rate sustains a negative reading rather than a brief dip, the structural preconditions for another liquidation cascade remain in place.
The One Leading Indicator Most Traders Are Underweighting
The Fear and Greed Index reaching 12 out of 100 on June 5 marks an emotional floor for this cycle. Historically, extreme fear readings have preceded short-term technical bounces, and Bitcoin did recover intraday toward USD 62,500 following the June 4 low near USD 61,300. CoinDesk's derivatives analysis noted, however, that Bitcoin could have further downside based on current positioning.
A key divergence makes any bounce structurally fragile: sentiment is at maximum fear, but the funding rate has already turned positive again, meaning leveraged longs have re-entered rather than staying out. When fear is extreme but leverage is reloading, the market lacks the forced-seller exhaustion that typically underpins durable bottoms. The CoinDesk assessment of current derivatives positioning as a warning sign reflects exactly this divergence.
The single most actionable indicator over the coming sessions is whether the perpetual funding rate sustains a move into negative territory. A sustained negative rate, not just the brief June 3 to June 4 dip, would confirm that leveraged longs have genuinely exited and that the USD 60,000 support zone is being tested without a new stack of long exposure accumulating above it. That is the signal that separates a reliable structural floor from another cascade setup.
What to Watch
- Bitcoin perpetual funding rate: a sustained negative reading, not a brief dip, is the confirmation that leveraged longs have been genuinely cleared rather than temporarily paused
- Open interest trajectory across all exchanges: a sustained decline from the June 2 peak of 773,000 BTC toward pre-buildup levels would confirm that de-leveraging is complete rather than interrupted
- Spot Bitcoin ETF daily flow data from Investing.com and CoinDesk: any reversal from the USD 3.4 to 3.5 billion outflow trend over 11 sessions would signal a shift in institutional sentiment
- The USD 60,000 support zone: a clean test and hold without a simultaneous spike in open interest or a return to positive funding rates is the technical prerequisite for a structurally reliable recovery
Ready to start trading?
Trade on Bitget Try CoinTech2uAffiliate links — we may earn a commission at no extra cost to you.
Related Articles
- Bitcoin's June 2026 Crash: USD 61,300 Low, USD 3B Liquidated, What's Next
- Crypto Liquidity Crisis: Super-IPO Era Reshapes Bitcoin in 2026
- Bitcoin's $1.85 Billion Liquidation Cascade Explained: June 2026
Frequently Asked Questions
What caused over USD 3 billion in Bitcoin liquidations between June 2 and June 4, 2026?
Three structural factors combined: institutional capital rotating from crypto into AI equities, spot Bitcoin ETF outflows exceeding USD 3.4 billion over 11 consecutive redemption sessions, and a historically over-leveraged futures market with open interest peaking at 773,000 BTC on June 2. Strategy selling 32 BTC worth USD 2.5 million and Mt. Gox wallet movements were sentiment catalysts that accelerated existing structural pressure rather than root causes.
Why did the Bitcoin funding rate turn positive again so quickly after the June 2026 crash?
New leveraged longs entered the market almost immediately after the June 4 liquidation event, pushing the annualized funding rate back to approximately positive 10% by June 5. The long-to-short ratio also recovered to 69% long versus 31% short, above the 65% threshold associated with crowded positioning. This indicates the structural risk that produced the original cascade has been partially reloaded by traders positioning for a bounce.
What does a Fear and Greed Index reading of 12 mean for Bitcoin in June 2026?
A reading of 12 out of 100 on BitDegree's index marks extreme fear and the emotional floor of this cycle, down from 23 in the days prior. While such readings have historically preceded short-term price recoveries, the current setup includes a divergence: sentiment is at maximum fear but the funding rate is already positive again, meaning leveraged longs have re-entered. Until the funding rate turns sustainably negative, any recovery lacks the structural confirmation of a genuine bottom.