Bitcoin's June 2026 Crash: USD 61,300 Low, USD 3B Liquidated, What's Next
Bitcoin crashed to USD 61,300 on June 4, 2026, with USD 3B liquidated in two days and 11 straight days of ETF outflows. Key price levels and signals
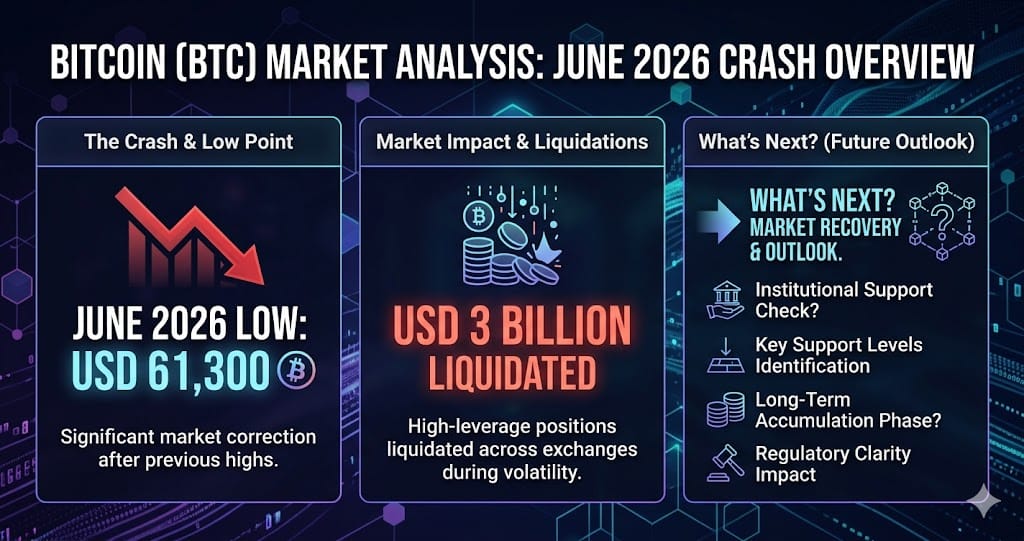
Bitcoin touched USD 61,300 on June 4, 2026, its lowest intraday print in the current correction, with the broader crypto market registering approximately USD 3 billion in total liquidations over just two days. From the USD 126,000 all-time high set at the end of 2025, BTC has now retraced more than 51%.
What separates this leg down from earlier drops is the identified cause: CoinDesk's June 4 analysis describes a cross-asset capital rotation, with investors moving funds out of crypto and into traditional AI semiconductor equities rather than a deleveraging event confined to crypto markets. Simultaneously, U.S. spot Bitcoin ETFs recorded a single-day sell-off of approximately USD 3.4 billion and their longest consecutive net-outflow streak since the products launched in early 2024, spanning 11 trading days.
How the Price Broke Down: Four Support Levels Breached in Four Days
The decline unfolded in a staircase pattern. BTC broke below USD 70,000 on June 2, printed USD 65,707 on June 3, then slipped through USD 66,000 and USD 64,000 before June 4 produced an intraday low of USD 61,300, with price stabilizing near USD 62,500 by late in the session. Each level that broke triggered cascading liquidations of leveraged long positions accumulated during the prior bull phase.
USD 60,000 is now universally cited as the final psychological support. Below it, derivatives data shows limited structural bids, and the options market has already shifted its center of gravity: the most actively traded contract in the past 24 hours on Deribit is the USD 55,000 put, indicating that traders are paying for downside protection at levels that were considered extreme just days ago.
ETF Outflows: Institutional Allocators Are Redeeming, Not Just Waiting
U.S. spot Bitcoin ETFs recorded what multiple data providers describe as a single-day all-time record sell-off of approximately USD 3.4 billion, according to Coinfomania and FXLeaders. The 11 consecutive trading days of net outflows that followed represents the longest uninterrupted outflow streak since these products were approved in early 2024.
This data reframes the correction narrative in a significant way. Earlier phases of this drawdown were driven by overleveraged retail longs being liquidated. The ETF data shows something structurally different: institutional allocators are actively redeeming exposure. CoinDesk identifies capital rotation into AI and semiconductor equities as the primary driver, a cause that did not appear in any earlier analytical phase of this correction, and which reflects a sector-level shift rather than crypto-specific sentiment.
Liquidation Depth and the Solana Open Interest Anomaly
June 3 alone registered between USD 1.65 billion and USD 1.86 billion in total liquidations depending on the reporting window, with long positions accounting for roughly USD 1.42 billion of that figure. BTC led the liquidation ranking at USD 693.64 million, followed by ETH at USD 473.82 million. Combined across June 3 and June 4, the two-day total sits near USD 3 billion, second only to the largest single liquidation day earlier in the year.
Total open interest across all crypto derivatives fell 8.5% over two days to USD 111.4 billion, and BTC-specific futures open interest declined from over 800,000 coins to 766,000 coins. A notable divergence complicates this picture: Solana open interest hit a record high of 72.16 million coins during the same period. Speculative leverage has not exited the market; it has rotated into SOL, creating a secondary cascade risk that could spill back into BTC if Solana prices fall sharply.
Negative Funding Rates and the Crowded Short Setup
Funding rates across Binance, Bybit, and OKX BTC perpetual contracts have remained structurally negative since approximately March 1, 2026. As of April 15, the 30-day moving average had been continuously negative for 46 days, the longest such streak since November 2022 in the immediate aftermath of the FTX collapse. In both prior historical instances of streaks this long, BTC was at or near a cycle low before recovering sharply.
The more significant signal is that open interest at major exchanges rose during this negative-rate period rather than contracted, a signature of new short positions being added rather than typical deleveraging. When short crowding accumulates alongside persistently negative funding, the historical resolution has been a violent upward short squeeze. The June 2 to June 4 price action has not yet produced that reversal, but the structural preconditions identified by this funding rate analysis represent a meaningful contrarian risk for traders currently holding leveraged short positions near USD 61,000 to USD 62,000.
What to Watch
- USD 60,000 BTC spot price: the universally cited last psychological support, with Deribit put open interest at the USD 60,000 strike now exceeding USD 1 billion in notional value
- U.S. spot ETF daily flow data: 11 consecutive net-outflow days as of June 4; a return to net inflows would be the earliest measurable signal of institutional sentiment stabilization
- Solana open interest: at a record 72.16 million coins despite falling prices, a sudden drop in SOL could trigger a secondary liquidation cascade with contagion into BTC and ETH
- Funding rate duration: the 46-day negative streak is historically associated with cycle lows in BTC perpetual markets, but requires confirming price action before being used as a long entry signal
Ready to start trading?
Trade on Bitget Try CoinTech2uAffiliate links — we may earn a commission at no extra cost to you.
Related Articles
- Crypto Liquidity Crisis: Super-IPO Era Reshapes Bitcoin in 2026
- Bitcoin's $1.85 Billion Liquidation Cascade Explained: June 2026
- Bitcoin's Record 67-Day Negative Funding Streak and June 2026 Liquidation Risk
Frequently Asked Questions
Why did Bitcoin fall to USD 61,300 in early June 2026?
Multiple factors converged simultaneously. Institutional investors redeemed spot Bitcoin ETF positions at a record pace, with a single-day sell-off of approximately USD 3.4 billion and 11 consecutive days of net outflows. CoinDesk reported that capital was rotating from crypto into AI and semiconductor equities. Hawkish Federal Reserve signals, a structurally broken derivatives market, and the mechanical cascade of leveraged long liquidations totaling USD 3 billion over two days amplified the move.
What does a 51% drawdown from the all-time high mean for Bitcoin's cycle?
From the USD 126,000 all-time high set at the end of 2025, a decline to USD 61,300 represents a 51.3% retracement. Drawdowns of this magnitude have occurred both before final cycle bottoms and as mid-cycle corrections in prior Bitcoin market cycles. The 46-day negative funding rate streak, measured through April 15, is a historically rare contrarian signal that has preceded recoveries in past cycles, though price confirmation is required before it can be acted on with confidence.
What is the USD 60,000 put options wall and why does it matter?
The USD 60,000 strike put contract on Deribit has accumulated open interest exceeding USD 1 billion in notional value, meaning a large number of market participants hold the right to sell Bitcoin at that price. This concentration creates a gravitational reference point in derivatives pricing. Below it, the most actively traded new contracts are USD 55,000 puts, which indicates the options market is pricing a meaningful probability of a test at that lower level if USD 60,000 fails to hold as support.