Bitcoin's June 2026 Crash: USD 59,100 Low and USD 1.73B Liquidations
Bitcoin hit a 2026 low of USD 59,100 on June 6 before rebounding USD 1,500. USD 1.73B liquidated, 291k traders forced out. Full data breakdown.
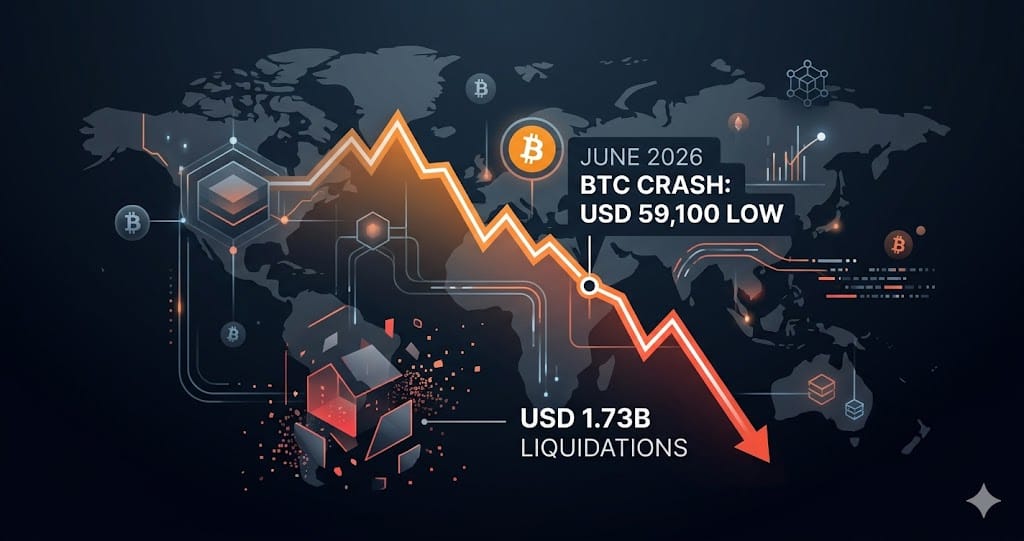
Bitcoin fell to USD 59,100 on June 6, 2026 — its lowest reading of the year — before recovering more than USD 1,500 to USD 61,336 in the same session. The two-day event across June 5 and June 6 became what CoinDesk described as crypto's worst two-day liquidation in months, erasing USD 1.73 billion in leveraged positions and forcing out 291,000 traders, 85% of them holding long positions.
The selloff traced back to June 2, when the single largest forced close of the cycle — USD 330.35 million at 08:00 UTC — anchored a USD 1.25 billion single-day total. Bitcoin absorbed USD 728.6 million, Ethereum USD 398 million, and Solana USD 89 million. Over the 30 days through June 7, cumulative liquidations reached USD 3.53 billion, reshaping the derivatives market in ways that require several data layers to read clearly.
The Cascade Timeline: June 2 Through June 6
The deleveraging unfolded in two distinct phases. June 2 produced the single largest forced liquidation of the cycle at USD 330.35 million at 08:00 UTC, contributing to a USD 1.25 billion single-day total. Bitcoin's share was USD 728.6 million, followed by Ethereum at USD 398 million and Solana at USD 89 million — the first time this cycle that Solana's derivatives book appeared as a clear third-tier casualty in the liquidation ladder.
The second phase arrived June 5 through 6. Bitcoin broke below USD 59,743 on June 5, then extended to USD 59,100 on June 6 before a V-shaped recovery took hold. Each test of the USD 59,000 to USD 60,000 zone has attracted fresh buyers, but the pattern also confirms this band as the core contested range where bulls and bears are repeatedly resetting positions.
Open Interest Reset: What Each Venue Shows
Total Bitcoin futures open interest fell from roughly USD 42 billion to USD 25 billion across May 2026, reaching a six-month low, but the aggregate obscures where the deleveraging actually happened. CME, which carries institutional and compliance-regulated positioning, fell nearly in half from USD 13 billion to USD 7 billion. Offshore perpetuals on venues including Binance, OKX, and Bybit dropped from USD 24 billion to USD 14 billion. On-chain perpetual DEXs were comparatively stable, declining from USD 5 billion to USD 4 billion.
The fastest retreat at CME aligns with the concurrent story of ETF outflows and institutional cash-and-carry unwinds. That arbitrage trade — buying spot ETFs while shorting CME futures — was earning annualized basis returns near 12% earlier in the cycle. By early June, that spread compressed to 4 to 5%, eliminating the yield incentive and triggering position closures. One important data conflict: Coinalyze's full-exchange OI reading as of June 4 stood at USD 51.54 billion, while Phemex's BTC-futures-only figure was USD 25 billion. Both are valid readings of different scopes, not contradictory errors.
Funding Rates: From Overcrowded Longs to Near Zero
The clearest derivatives signal is the 8-hour funding rate. From April through early May 2026, longs on major CEXs were paying 0.05% to 0.08% per 8-hour window — annualized to roughly 55% to 88% — a level that marks an overcrowded long base absorbing continuous fee drag. By late May, that rate had collapsed to a range of -0.005% to +0.005%, crossing zero and signaling that leveraged longs had stopped paying a premium for long exposure.
When funding turns negative, short positions begin paying longs to hold, which creates conditions for a short squeeze if spot demand recovers. Phemex and CoinDesk both noted this dynamic in the June 4 to 7 window, drawing a comparison to the February 2026 OI reset where Bitcoin open interest contracted from roughly USD 40 billion to USD 28 billion, rates neutralized, and price subsequently recovered from the range floor. The structural parallel is notable, though it does not function as a forecast.
Fear and Greed Index at 11: Reading the Sentiment Floor
The Crypto Fear and Greed Index touched 11 intraday on June 3, falling from a reading of 23 within a single 24-hour window — a more than 50% collapse in sentiment. Gate Blog and Milkroad flagged this as the emotional low of the correction. A reading of 11 sits deep in Extreme Fear territory, and multiple outlets published historical analyses of recovery patterns following comparable troughs, though prior patterns carry no guarantee of recurrence.
By June 6 and 7, the index had recovered slightly but remained in the low teens. The alignment between the Fear and Greed floor, the OI contraction, and the funding rate crossing zero creates a convergence of indicators that historically precedes range-bound consolidation or a spot-driven recovery. The critical variable is whether spot demand — from ETFs, retail allocators, or institutional buyers — re-enters the market, since the derivatives fuel for another cascade has been substantially cleared.
What to Watch
- BTC USD 59,000 to USD 60,000 support zone: every test through June 7 produced a V-shaped recovery, but a high-volume close below USD 59,100 would open the USD 56,000 to USD 57,000 range as the next technical reference
- CME Bitcoin open interest: institutional positioning fell from USD 13 billion to USD 7 billion in May 2026; a recovery back toward USD 10 billion would signal institutional re-entry and support the structural reset thesis
- 8-hour funding rates on Binance, Bybit, and OKX via CoinGlass: a sustained return above +0.02% per 8 hours signals leveraged longs are rebuilding, which changes the short-squeeze probability significantly
- Cash-and-carry basis spread: basis compressed from 12% to 4 to 5% annualized by early June; a rewidening toward 8% would indicate arbitrage capital is returning and CME open interest is being rebuilt by institutional hedgers
Ready to start trading?
Trade on Bitget Try CoinTech2uAffiliate links — we may earn a commission at no extra cost to you.
Related Articles
- Bitcoin's USD 3 Billion Liquidation Cascade: What Funding Rates Signal in 2026
- Bitcoin's June 2026 Crash: USD 61,300 Low, USD 3B Liquidated, What's Next
- Crypto Liquidity Crisis: Super-IPO Era Reshapes Bitcoin in 2026
Frequently Asked Questions
What caused Bitcoin to fall to USD 59,100 in June 2026?
The drop was driven by cascading liquidations rather than a single macro catalyst. The first wave hit June 2, when a forced close of USD 330.35 million at 08:00 UTC anchored a USD 1.25 billion single-day total across Bitcoin, Ethereum, and Solana. A second wave on June 5 and 6 extended losses below the prior low of USD 59,743 to a new 2026 floor of USD 59,100. Across the trailing 30 days through June 7, cumulative liquidations reached USD 3.53 billion.
How do the Phemex and Coinalyze open interest figures differ, and which should traders use?
They measure different scopes and are not directly comparable. Phemex's USD 25 billion figure tracks Bitcoin futures specifically across a defined set of venues and reflects a six-month low as of late May to early June 2026. Coinalyze's USD 51.54 billion figure applies a full-exchange, cross-asset scope as of June 4. For tracking BTC-specific leverage buildup or unwinding, use Coinalyze's BTC-only filter or CoinGlass to isolate the relevant instrument.
Does a near-zero or negative funding rate mean Bitcoin will recover?
Not automatically, but it does remove a mechanical source of continued selling pressure. A funding rate near zero, as seen across major CEXs in late May and early June 2026, means the leveraged long overhang has been cleared. If rates turn and stay negative — meaning shorts pay longs — it can precondition a short squeeze when spot buyers step in. The February 2026 OI reset offers the closest recent precedent: after a comparable deleveraging, Bitcoin consolidated before recovering, driven by spot demand rather than a derivatives-led event.