BTC and ETH Liquidations Flip Long in May 2026: What the Data Shows
On May 13 2026, USD 127M in crypto futures were liquidated with longs dominant for the first time in weeks. Here is what the on-chain and derivatives
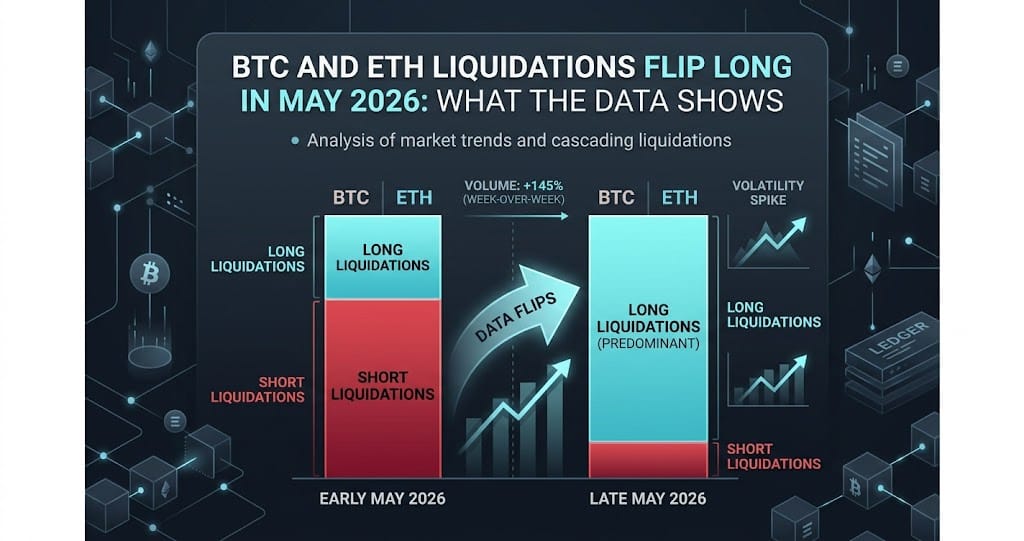
On May 13, 2026, crypto futures markets recorded USD 127 million in 24-hour liquidations, and for the first time in the current cycle, long positions dominated — BTC longs accounted for 57% of its USD 62.44M cleared, while ETH longs made up an extreme 81% of its USD 45.07M. This directional flip closed out a three-stage short-squeeze chain that ran from May 4 through May 12.
The event coincided with BTC opening at USD 80,473.98, down 1.5% from May 12, and ETH at USD 2,274.41, down 2.8%. Total BTC open interest across all venues had already collapsed from an all-time high of USD 112 billion on May 10 to USD 59.58 billion by May 13 — a roughly 47% contraction in under 72 hours. Understanding what drove that drawdown, and what it signals next, requires looking at funding rates, cross-exchange structure, and altcoin positioning together.
The Three-Stage Short Squeeze That Set Up the Long Trap
Between May 4 and May 12, the market cycled through three distinct liquidation events, each dominated by short positions being forced out. The May 4 flush cleared USD 301.93M in shorts across 97,235 traders. May 7 was the peak, with USD 415.57M in short liquidations. By May 9, that pressure had dropped to USD 50.26M, and on May 11 the long-to-short ratio in liquidations reached a near-parity of 1.18 to 1. These events drove BTC up toward the USD 82,000 level on Bitfinex during May 12 intraday trading, which acted as a short-gamma acceleration zone.
The problem is that retail and leveraged participants chased the move. By the time BTC touched USD 82,000, the market had absorbed three consecutive short squeezes, and new long positions were being opened at the local top. When BTC pulled back and opened May 13 at USD 80,473.98, those overleveraged longs became the next source of forced selling. ETH's 81% long-dominated liquidation ratio on May 13 is the clearest quantitative signal of that dynamic — it marks USD 82,000 on BTC and roughly USD 2,300 on ETH as the confirmed local cycle high for the April 18 to May 12 window.
OI Collapse: Voluntary Deleveraging, Not a Cascade
The shift from USD 112 billion in total BTC open interest on May 10 to USD 59.58 billion on May 13 looks alarming on the surface, but the mechanics tell a different story. Total forced liquidations on May 13 were only USD 127 million — a number that cannot account for a USD 52 billion OI reduction. The vast majority of that contraction came through voluntary position closing: hedge unwinds, spread trades being dismantled, and basis arbitrage positions being taken off.
This pattern matches the characterization offered by Markus Thielen of 10x Research, whose April 27 commentary in CoinDesk described the prior months of negative funding as reflecting institutional structural hedging rather than directional bearishness. Funds using cash-and-carry trades — holding spot or ETF exposure while shorting perpetuals — were systematically unwinding those positions as the basis compressed. The result is a market that absorbed a historically large deleveraging event without a full cascade, which means the next buildup of open interest starts from a cleaner base rather than a pile of forced-out wreckage.
Funding Rates: 46 Days Negative, Then a Reset, Then Fragmentation
As of April 15, 2026, BTC's 30-day average funding rate had been negative for 46 consecutive days — the longest negative-funding streak since the FTX collapse drove BTC below USD 16,000 in November 2022. CoinDesk reported this milestone on April 16. The structural cause, as Thielen noted, was not mass bearishness but institutional delta-neutral positioning: funds shorting perpetuals to hedge long spot or ETF books, paying or receiving funding as a cost of carry rather than a directional bet.
By the May 9 to May 10 window, MEXC News confirmed that funding rates had flipped from negative to neutral across major BTC pairs. That reset, however, did not produce uniform conditions across assets. On Binance as of mid-May, BTC funding was -0.0042%, ETH was -0.0023%, DOT had dropped to a deep -0.0472%, and DOGE sat at -0.0141%. SOL was the outlier: +0.0072% on Binance, with 69.3% of open interest held long against 30.7% short, and total OI at USD 842.3 million. SOL had effectively become the primary risk-appetite outlet in the altcoin space while BTC and ETH remained under negative-funding pressure.
Cross-Exchange Structure: Hyperliquid's Hourly Funding and the Institutional Arbitrage
One underappreciated factor in the May 2026 liquidation cluster is the structural difference between exchange funding-rate mechanisms. Binance settles funding every 8 hours with floating rate caps. Hyperliquid settles every hour with a maximum rate of 4% per hour, which means in extreme conditions a single day of funding on Hyperliquid can reach 96%. This compounding speed explains why high-profile blow-ups — including the Hyperliquid whale identified as 0x128e, who entered a USD 20.3 million 40x BTC short around May 6 and was within 2% of its USD 82,236 liquidation price during the May 12 intraday high — tend to cluster on that venue.
Institutions have been exploiting this gap systematically. A delta-neutral strategy of going long on Binance while shorting on Hyperliquid captures the funding-rate differential at a typical annual rate of 3% to 5% under normal conditions, rising above 20% during periods of rate divergence, according to an April analysis by ArbitrageGhost on Medium. Binance holds roughly 34% of global BTC perpetual open interest, giving it dominant price-setting power, while Hyperliquid attracts a disproportionate share of high-leverage directional bets. The result is a structural transfer: retail traders paying elevated funding on Hyperliquid effectively subsidize institutional arbitrageurs running flat books across both venues.
What to Watch
- BTC sustained move below USD 78,000 to USD 79,000 would trigger SOL and XRP long cascades given SOL's 74.4% long positioning and XRP's 72.1% long ratio at current OI levels
- DOT funding rate at -0.0472% is the deepest negative reading across major altcoins and warrants monitoring for a violent short-squeeze if spot demand returns
- The Hyperliquid 0x128e whale short at 40x with a USD 82,236 liquidation price remains open as of May 13; a BTC recovery above USD 81,500 revives the liquidation-trigger risk
- ETH's combination of negative funding (-0.0023%), USD 5 billion in Binance OI, and net exchange inflows of over USD 500 million between May 6 and May 9 creates a triple-pressure setup that has not fully resolved
Ready to start trading?
Trade on Bitget Try CoinTech2uAffiliate links — we may earn a commission at no extra cost to you.
Related Articles
- AI Agents Are Driving Crypto's Biggest Narratives in 2026
- Bitcoin Liquidation Cascade May 2026: OI Breaks $112B ATH
- Crypto Narratives May 2026: THYP ETF, DeSci, and Institutional Rotation
Frequently Asked Questions
Why did long positions get liquidated more than short positions on May 13, 2026?
After three consecutive short-squeeze events between May 4 and May 12, leveraged traders opened new long positions near the local high of roughly USD 82,000 on BTC. When BTC pulled back and opened May 13 at USD 80,473.98, those longs were underwater and forced out. ETH was the most extreme case, with 81.07% of its USD 45.07 million in May 13 liquidations coming from long positions, confirming that the prior squeeze cycle had attracted excessive long leverage at the top.
What caused BTC open interest to drop from USD 112 billion to USD 59.58 billion so quickly?
The reduction was primarily voluntary rather than forced. Total forced liquidations on May 13 were only USD 127 million, which is far too small to account for a USD 52 billion OI decline. The contraction reflects institutional unwinding of delta-neutral strategies — cash-and-carry trades, basis arbitrage, and ETF-hedge pairs — that had built up during the prior weeks of negative funding rates. When the basis compressed and funding normalized around May 9 to May 10, those structured positions were methodically closed.
What is the significance of BTC having 46 consecutive days of negative funding as of April 15, 2026?
It was the longest negative-funding streak for BTC since the FTX collapse in November 2022, when BTC traded below USD 16,000. The cause in 2026 was structurally different: rather than reflecting mass bearishness, it reflected institutional delta-neutral positioning where funds shorted BTC perpetuals to hedge long spot or ETF exposure. Markus Thielen of 10x Research confirmed this interpretation in a CoinDesk piece on April 27, noting that the negative funding was a hedging cost rather than a directional signal. The streak ended when funding returned to neutral during the May 9 to May 10 window.


